Pages

Tuesday, May 10, 2011

Formation Gaps In Charts, Trading Range, Area of Suspended When Happened Gaps


Gaps / Price Gap is an area in the graph where there is no single transaction ever occurred. This pattern is formed due to a flood of orders too selling / buying or selling transaction void or purchase.

Formation of gaps that lead down to reflect weak market, otherwise gaps that lead to above reflects the strong market. But both reflect the potential strength of price movement which will follow later.

The price gap or gaps divided into four: Common Gaps, Breakaway Gaps, Runaway Gaps, and Exhaustion Gaps.

1. Common G
aps
Common Gaps, Gaps like this kind are often encountered, namely the direct gaps be closed later. This pattern is a mengistilahkan closing windows. Display below are examples of events that immediately closed gaps

Common gaps appear in the area that caught the then experienced a strong pressure to move or on the condition of movement within a certain price range

2. Breakaway G
aps
Breakaway gaps occur when prices penetrate the area who are stuck or trading range. That is the price moves in a certain price range in recent periods, to understand the gaps one must understand the natural processes in the area on hold.

A good confirmation of trading gaps, such as pricing pressure experienced when approaching the price support. You should see up close how the formations are formed.

3. Runaway G
aps
Runaway Gaps, Gaps type illustrates clearly that when prices move sharply then the price affect the price movement.

A theory says that the size of these gaps size is half of the movement. There is another statement saying that Runaway Gaps is a measure to decide how long the trend will stop. Although difficult to prove at least to help us take a stand on this pattern visible.

4. Exhaustion
Gaps
Signal which indicates that the price trend will end one of them is Exhaustion gaps. Exhaustion gaps are price movements that occur near the end of the trend up or trending down.

to be continued ...

source: the master trader

The Principle Of Elliot Wave


Elliot Wave discovered by Ralph Nelson Elliot in the late 1920s. He found that the stock market has certain characteristics, and not moving irregularly, but the stock price is always repeating itself, which reflects human actions and emotions that caused exterior influences and mass psychology.

Basically, the Elliott Wave principle based on the Dow Theory, which also defines price movement in waves, but Elliott discovered the fractal nature of market action. So Elliott to analyze market depth, identify the specific characteristics of wave patterns and making detailed market predictions based on patterns that have been identified.

Fractals are mathematical structures, which occur on a smaller scale infinitely repeat. The pattern found in Elliott was built in the same way. Impulsive wave, which runs with the main trend, always shows five waves in the pattern. On a smaller scale, in each of the impulsive wave as isebut before, will be found again five waves.

Basic Principles
According to the laws of physics: "Every action creates an equal and opposite reaction." The same applies to financial markets. A price movement up or down must be followed by a reverse movement, as the saying goes: "What goes up must come down" (and vice versa).

Price movements can be divided into trends on the one hand and corrections or sideways movements on the other. Trends show the main direction of prices while corrections move against the trend. In Elliott wave terms is called impulsive and corrective waves. Impulse wave formation has five distinct price movements, three in the direction of the trend (I, III, and V) and two against the trend (II and IV).
Complete Cycle Elliot Wave
In his book The Wafe Principle, and in articles published by the magazine Financial Worid, RN Elliot mentioned that the stock market moves in five-wave pattern (wave) rose and three-wave down to complete a cycle of eight waves.

A complete cycle consists of eight waves, then built with two waves of two distinct phases, motive phase (five waves) in which each subwave depicted in each figure (Wave 1, 2, 3, 4, and 5), and the corrective phase is described by letter (wave a, b, and c)

to be continued..

The Advantages Compared With A Bar Chart Candlestick Chart

There are three main advantages of candlestick charts compared with bar charts.

1. Candlestick charts more visual than on a bar chart (Visually immediate). Try once in a while you are using candle charts, it's easier to see what happened during that period, day, week, hour or minute.
 

With bar charts we need mental enough to do execution price. We need to say to ourselves,''tick to the left states where the price is opened, tick the right of states where where the price closed. Now I understand that the period of rise. "With a candlestick chart he did it all to you. You can use the energy fatherly analyze, not to describe what happens with prices.
 

2. With candles you can see the trends more quickly by finding out if it is light or colored candle. In the period of the trend we can explain with specifics regarding price formation.Candle making it easier to price a wide range comprehension during the day. Candlestick wide show something dramatic happens to the price. While a narrow price range may indicate there is little agreement on price.

3. Most importantly, the candlestick is vital to show the direction of market movements that turn. This usually happens in the short term, to be more precise please find these things when your own trading.
When told about the reversal of traditional techniques, it is usually associated with the pattern that occurred during the period of time. Typical is the double top reversal pattern as well as head and shoulders. As a definition, it involves the distribution of the smart money on the price to the naive traders and normally occurs within a few weeks or months.

Candlestick accurately able to describe changes in a trend which occurred at the end of each swing in the short-term period. If you carefully pay attention to often candlestick signals to you regarding the changes occurring.

Bar vs Candlestick Chart

Below is the data for three months of Bar Chart and Candlestick Chart for IBM's stock price. Consider the two graphs is whether there are differences on the data presented.
Hard as possible to show difference, it's because there is no difference. Both, bar charts and candlestick charts both contain exactly the same information, just presented in different forms. Both bar charts and candlestick charts contain the same data, the highest price within a certain period (daily), the lowest price, opening price, closing price.

In candlestick charts, the name alone is changed. The difference between the open price and closing price is called 'real body'. The prices are higher than the body called 'upper shadow' is a lower-called 'lower shadow'. If his candle light or white it means the opening price is lower than the highest price in that period. If a dark-colored candle shall mean the price moves down. As the picture below.

Optimism and Pessimism shown by Candle Market
In general we know that at the time of opening the price is usually dominated by the amateur trader or novice trader. On the other side's closing price is dominated by professional traders. The lowest price may be said that the price was established by the traders who are pessimistic, they believe that the market likely will fall further and make the position of selling at the base/ bottom.
The highest price was established by the pessimists. They paid the top price but they are not correct in their analysis, at least in the short term.
 

The candlestick users may understand the combined concept. Here will be given one example, but you can experiment further with your own ideas.
Shaven Bottom/ Shaven Head. Shaven Bottom/ Shaven Head described the period in which prices opened lower and closed above. A period in which amateurs are also pessimistic. They sell them at the beginning immediately devoured by the voracious buyers. And at the end of the period of professional traders who are optimistic and at prices close sharply higher. And this bullish candlestick can often predict the opening price for the period selanjunya.

Monday, May 9, 2011

21 Name Of Candlestick Which Must be Acknowledge By Trader III


Candle 15: Harami or Pregnant
When we look at candle harami, we would imagine that the first candle as a mother and her child is like the second candle which emerged from the belly. That's where the name originated harami or pregnant women. Candlestick harami can occur when trending up or trending down, such as arise in conditions even though it appears that a bullish uptrend is still controlling the market but as a potential reversal signal.
Candle 16: Marubozu
In Japan Marubozu mean closed-cropped (cut short) or other designations shaven shaven head or bottom. A typical candle candlestick marubozu a long body, indicated at that time the market is in a wide range. And with a short shadow, or almost without shadow shows that the price moves up (white candle) and stir down (black candle) without hesitation.
Candle 17-18: High Wave and Spinning Top
High Wave and the Spinning Top is a candlestick that expresses doubt and confusion. An interesting question about this candlestick, whether high wave and spinning top is a reversal of marubozu? The answer is relative, certainly when it comes marubozu reflect the buyer and seller actually agreed on the market, this contrasts with spinning tops and high wave that indicates a situation in which buyers and sellers is difficult to find a deal.
Candle 19: Three Black Crows
Candle Three Black Crows, formations that rarely happens in the market. And while true swing trader must be alert on this candlestick. Three Black Crows reflect that the seller has control back in the market price, and possible further price it to move down.
Candle 20: Three White Soldiers Advancing
Bullish for three couples candle Black Crows known as the 'three white Soldiers' and by the theorists regard it as one of the candlestick pattern that gave a strong signal to rise or bullish.
Candle 21: Tweezers
Tweezers, can help the trader to immediately take advantage of in the can on the market. According to the experience of tweezers candles are rare in the market. But when it happens they are almost always significant. Type of tweezers according to the theory that there are two tweezers tweezers top and bottom and traders known as the pattern of a double bottom or double top.

21 Name Of Candlestick Which Must be Acknowledge By Trader II

Candle 9: Dark Cloud Cover
That the Dark Cloud Cover occur after a strong uptrend and bearish conditions began to fill the market. Dark Cloud alert and protect the profits gained because in the short term prices will reverse direction.
Candle 10: Piercing, Signal Reversal Potential
If Dark Cloud Cover gives warning that the uptrend will end soon, otherwise the previous candlestick shows that the price will go down, otherwise Candle Piercing indicating that the downtrend will end / reverse direction, and conditions began to fill the market bullish.
Candle 11-12: Evening Star and Morning Star
Evening Star pattern typically occurs during a sustained uptrend. The existence of Star convey that the bullish and bearish pressure is attractive, but neither side wins. Then comes the third candle with a black real body, giving a strong signal that prices will reverse direction.
Next is a Morning Star candle. The Morning Star Formation candle is the opposite of the principle of the Evening Star which occurred during the downtrend begins with a black candle, then a third star and the candle into a complete reversal signal.
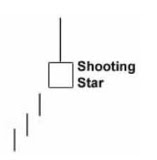
Candle 13: Shooting Star
Shooting Star Candle can only occur in a rising market potential. And now comes this candlestick would be a warning that the minor uptrend will experience a reversal. On Shooting Star is a small body and long upper shadow indicates that the bullish pressure is controlled by a bearish pressure.
Candle 14: Inverted Hammer
If we see the Inverted Hammer candlestick glance seem similar to the Shooting Star. The difference occurs at the end of the Shooting Star trending up, while the Inverted Hammer occurs after a significant decline took over.

Sunday, May 8, 2011

21 Name Of Candlestick Which Must be Acknowledge By Trader

Candlestick is one of the tools of technical analysis provides the most accurate information of the many indicators that are owned by traders. Candlestick used in Japan since 1978 and only popular in the western world in the 1990s. Since then Candlestik become the primary tool for traders in analyzing the market to replace the position of bar charts.

There are 21 names that should be known by the candlestick trader. 21 Candlestick was the candlestick pattern that most often appear on the market and can be used in making decisions in trading. Please note that the names of the candlestick was created to help traders identify as early as possible in the market, selling pressure atapun buy all implied in the candlestick.


21 name or candlestick patterns that include the following:


Candles 1-4: Four Types Doji
We call it "Common Doji" because it's so common, usually occurs in small trading range. Doji the middle where the price reflects the strength of the seller and buyer balanced so can not be used to decide the selling or buying transaction.


Long Legged Doji candlestick can be said that more dramastis. It is said that the higher prices rise further there taking profit, so prices go back to the middle. Candlestick like this show a weakening of market forces.
 

Gravestone Doji, among all this candlestick candlestick probably the most unpleasant. Where prices have reached above can not hold altitude and back, and closed at the same level.

Dragonfly Doji, final form of the doji, where the open price is the highest price, sold and then closed again at the open price. The Candlestick is according to experience are rare, and when it happens then the price will tend to rise or bullish.


Candles 5-6: Hammer and Hangman, or Reversal Reversal Signals
Hangman, this candlestick so named because it is seen as someone who was executed with the leg swinging, always occurs after the extension of the trend rise. Analogues that traders see a sell-off, and hastily taking a position but then they discover that they can buy at prices much cheaper.

Other Side of Hammer arise from the extension trending down (downtrend). Hammer is due to strong selling pressure when prices are often at the opening, for subsequent recovery and then markets have closed down close to open price or higher.
Candles 7-8: Bullish and Bearish Engulfing
Bullish Engulfing occurs after a significant downtrend. Engulfing has a characteristic body covering the previous candlestick body and has no shadow or shadows. The existence of this Candlestick signal that the seller started weak force, charged by buyers pressure.

A Bearish Engulfing occurs after a significant uptrend. Once again, there is not the candlestick body shadow or shadows. Bearish Engulfing reflect that strength weakened buyers and sellers full controlled the price. 

source: 21 Candlestick every Trader should know book

Technical Analysis And The Dow Theory

Technical Analysis has become very popular lately, many people believe that the historical data of prices is a strong indication to analyze price movements in the future because of price movement that is always repeated.
 

"Technical analysis is the study of market behavior is illustrated through graphs, to predict the trend (trend) price in the future." (John J. Murphy)

Traders who use technical analysis not believe that prices move randomly so that the price movements to predict whether the trend or pattern. Examples of images that form the pattern of price movement trend in EURUSD currency period September 2010


EURUSD price action formed trending up, and several times the price movements have reflected the level of support.


Besides moving based on trends, price movements also form patterns that can be learned. Here is an example EURUSD price action pattern display period from May 2008.

Price Movement EURUSD above as seen form a double top pattern.

Basic Technical Analysis The Dow Theory


1. The Market Knows Everything. Prices are going really reflect the whole information. Everything has been reflected through the supply and demand which in turn affects price movement. Since all information is reflected in the price, the price of what happens is the actual value of the existing events in the market


2. Price Move In Trend. All of the analysis agree that the price moves based on the trends and prices move in a certain period of random or random. Therefore technicalis  or people who use technical analysis believe that it is possible to identify trends, make transactions based on the trend and make a profit by exploiting the trend.


3. Trends Exist Until It Is Not Broken. Price movements in a certain time to form patterns of trends and conditions will change if the signal trend reversals (reversal) has been confirmed. Trait that emerged was the consolidation of the price or trading range that is located at the midpoint of the price or have a balance due to price pressures. If the price support and resistance in the movement has penetrated the price trend will continue whether it suffered a reversal or continuation price.


4. The History Repeat. The pattern is always the price move repeatedly because of human psychological measures to changes of supply and demand are also likely to repeat that something we learned about technical analysis is about the price patterns are always the same from time to time.


5. Has Three Market Trends. It should be understood that the price movements are built from short-term movements (minor), medium (intermediate) and long-term (major). With three movement patterns that help the traders in determining the proper timing to execute the transaction.


source: book the master trader

What's With Technical Analysis

"After I learned over the years, increasingly complex and a lot of input in the trading plan could lead to confusion, frustration, and reduce the victory." (Jim Wyckoff)

"Simple is easier and better." (Stuart Taylor)


Currently, many technical indicators are designed to help traders to analyze price movements. As the Supreme Court or a Moving Average to determine price trends and psychology, MACD to see the momentum of price movement, the RSI for informed and overbought or oversold and others.


However, many technical indicators are used, does not guarantee the traders correctly predict price movements, rather than getting a big profit is even confusion when executing the price because the indicators used to give conflicting signals to buy or sell.


Some Weaknesses of Technical Analysis


1. Technical analysis is biased
Technical analysis is very subjective and this condition can be reflected when we do the analysis. When we analyze the price and the chance prices will go up bullish bias conditions shadowing, and then when the market moves down the technical conditions will indicate down or bearish.


2. Technical Analysis Opens Many Interpretation
Technical analysis or interpretation opens a lot of interpretation. Between analysis and the other one had a different prediction by looking at the same price. Each person can create support and resistance lines are logical to justify their respective positions. In addition, with different time frames will find a variety of different information.


3. Very Late
Technical analysis is often criticized for being too late to provide information. When you run a transaction at the time of analysis was confirmed in long-term period and will find that what you did was too late. Conversely, if you rely on short-term time frame you will find a lot of false signals is only temporary.


4. Always Having a Changing Price Level change
In technical analysis pursued many levels and always changing from one target to the next target, it shows that technical analysis does not have a permanent establishment. For a trade where the exact level is not easy problem. Often we take the wrong decision assumes a price-level resistance to its lowest price or the level of support.


5. Do not Have Certainty
Not all technical signals and patterns are reliable chart pattern. When starting to learn technical analysis we will find patterns and indicators that do not support each other. For example, we will do the cells because the pattern is formed Double Top and the price through the neckline. But after we see the indicator was not showing confirmation. We begin to doubt lest the price at which we do sell is a price support to form a pattern of Triple Top.


Conclusion:
In addition to having many advantages Technical Analysis also found that there are shortcomings that need to be wary of. Therefore it is advisable for traders to use a maximum of two or three technical indicators and as traders we are required to be more flexible.